Tabla Mundial
SEPTIEMBRE 29, 2021
COVID-19: Daily dashboard
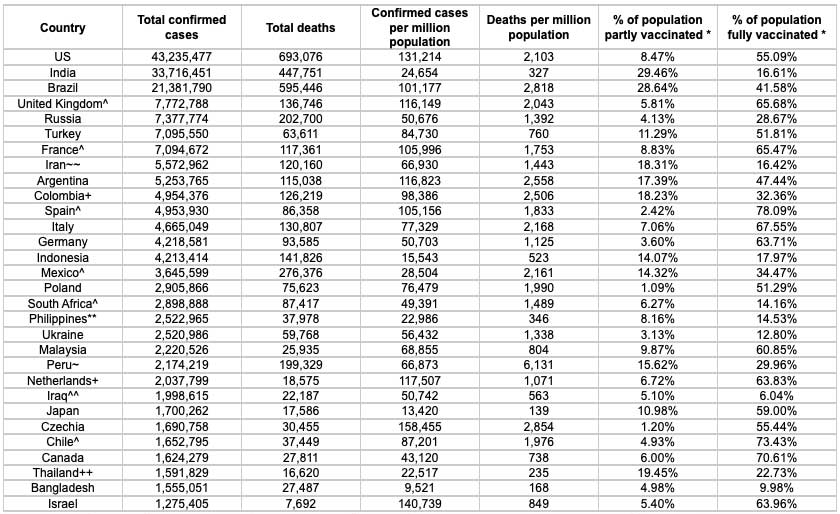
Global case count (as of September 29, 09:21 ET): 232,909,046 confirmed cases; 4,768,139 deaths (2.0%). The following are the 30 countries with the highest case counts as of September 29, 09:21 ET.
|
Country |
Total confirmed cases |
Total deaths |
Confirmed cases per million population |
Deaths per million population |
% of population partly vaccinated * |
% of population fully vaccinated * |
|
US |
43,235,477 |
693,076 |
131,214 |
2,103 |
8.47% |
55.09% |
|
India |
33,716,451 |
447,751 |
24,654 |
327 |
29.46% |
16.61% |
|
Brazil |
21,381,790 |
595,446 |
101,177 |
2,818 |
28.64% |
41.58% |
|
United Kingdom^ |
7,772,788 |
136,746 |
116,149 |
2,043 |
5.81% |
65.68% |
|
Russia |
7,377,774 |
202,700 |
50,676 |
1,392 |
4.13% |
28.67% |
|
Turkey |
7,095,550 |
63,611 |
84,730 |
760 |
11.29% |
51.81% |
|
France^ |
7,094,672 |
117,361 |
105,996 |
1,753 |
8.83% |
65.47% |
|
Iran~~ |
5,572,962 |
120,160 |
66,930 |
1,443 |
18.31% |
16.42% |
|
Argentina |
5,253,765 |
115,038 |
116,823 |
2,558 |
17.39% |
47.44% |
|
Colombia+ |
4,954,376 |
126,219 |
98,386 |
2,506 |
18.23% |
32.36% |
|
Spain^ |
4,953,930 |
86,358 |
105,156 |
1,833 |
2.42% |
78.09% |
|
Italy |
4,665,049 |
130,807 |
77,329 |
2,168 |
7.06% |
67.55% |
|
Germany |
4,218,581 |
93,585 |
50,703 |
1,125 |
3.60% |
63.71% |
|
Indonesia |
4,213,414 |
141,826 |
15,543 |
523 |
14.07% |
17.97% |
|
Mexico^ |
3,645,599 |
276,376 |
28,504 |
2,161 |
14.32% |
34.47% |
|
Poland |
2,905,866 |
75,623 |
76,479 |
1,990 |
1.09% |
51.29% |
|
South Africa^ |
2,898,888 |
87,417 |
49,391 |
1,489 |
6.27% |
14.16% |
|
Philippines** |
2,522,965 |
37,978 |
22,986 |
346 |
8.16% |
14.53% |
|
Ukraine |
2,520,986 |
59,768 |
56,432 |
1,338 |
3.13% |
12.80% |
|
Malaysia |
2,220,526 |
25,935 |
68,855 |
804 |
9.87% |
60.85% |
|
Peru~ |
2,174,219 |
199,329 |
66,873 |
6,131 |
15.62% |
29.96% |
|
Netherlands+ |
2,037,799 |
18,575 |
117,507 |
1,071 |
6.72% |
63.83% |
|
Iraq^^ |
1,998,615 |
22,187 |
50,742 |
563 |
5.10% |
6.04% |
|
Japan |
1,700,262 |
17,586 |
13,420 |
139 |
10.98% |
59.00% |
|
Czechia |
1,690,758 |
30,455 |
158,455 |
2,854 |
1.20% |
55.44% |
|
Chile^ |
1,652,795 |
37,449 |
87,201 |
1,976 |
4.93% |
73.43% |
|
Canada |
1,624,279 |
27,811 |
43,120 |
738 |
6.00% |
70.61% |
|
Thailand++ |
1,591,829 |
16,620 |
22,517 |
235 |
19.45% |
22.73% |
|
Bangladesh |
1,555,051 |
27,487 |
9,521 |
168 |
4.98% |
9.98% |
|
Israel |
1,275,405 |
7,692 |
140,739 |
849 |
5.40% |
63.96% |
* Data sourced from https://ourworldindata.org/covid-vaccinations#source-information-country-by-country and are as of September 28, unless otherwise indicated; A person is considered partly vaccinated if they have received only one dose of a 2-dose vaccine protocol. A person is considered fully vaccinated if they have received a single-dose vaccine or both doses of a two-dose vaccine.
^ Vaccination data as of September 27; + vaccination data as of September 26; ~ vaccination data as of September 25; ^^ vaccination data as of September 23; ++ vaccination data as of September 22; ~~ vaccination data as of September 20; ** vaccination data as of September 20.
Reference: https://coronavirus.jhu.edu/map.html
SOURCE: Johns Hopkins University CSSE; Our World in Data
Tabla de España
Datos acumulados por comunidades.
|
Comunidad |
Positivos* |
Diagnosticados el día previo |
Diferencia dato anterior |
Muertes |
Positividad (%)** |
|
Cataluña |
915.835 |
222 |
955 |
15.664 |
2,3% |
|
Madrid |
890.485 |
288 |
397 |
16.094 |
2,6% |
|
Andalucía |
801.281 |
81 |
317 |
11.117 |
3,5% |
|
C. Valenciana |
510.005 |
50 |
226 |
7.759 |
4,0% |
|
Castilla y León |
299.238 |
99 |
114 |
7.309 |
3,2% |
|
País Vasco |
260.253 |
85 |
108 |
4.930 |
2,5% |
|
Castilla La Mancha |
237.463 |
22 |
140 |
6.442 |
4,2% |
|
Galicia |
186.460 |
18 |
36 |
2.633 |
1,7% |
|
Aragón |
160.734 |
81 |
78 |
3.815 |
5,3% |
|
Murcia |
140.739 |
34 |
54 |
1.727 |
4,2% |
|
Extremadura |
102.388 |
54 |
55 |
1.981 |
2,6% |
|
Baleares |
99.234 |
19 |
69 |
959 |
2,8% |
|
Canarias |
95.108 |
86 |
95 |
990 |
2,2% |
|
Navarra |
82.507 |
23 |
27 |
1.246 |
2,0% |
|
Asturias |
70.874 |
15 |
17 |
2.066 |
0,9% |
|
Cantabria |
46.116 |
49 |
50 |
607 |
3,8% |
|
La Rioja |
39.450 |
9 |
10 |
823 |
1,9% |
|
Melilla |
10.979 |
7 |
9 |
107 |
4,7% |
|
Ceuta |
7.542 |
4 |
4 |
128 |
4,1% |
|
España |
4.956.691 |
1.246 |
2.761 |
86.397 |
2,9% |
* Casos totales confirmados por PCR hasta el 10 de mayo, por PCR e IgM (sólo si hay sintomatología compatible) según la estrategia de vigilancia desde el 11 de mayo y PCR y pruebas de antígeno desde noviembre.
Fuente: Ministerio de Sanidad 29/09
Dejar Comentario
 Newsletter
 Contacto


